After a sampling campaign concludes, most brands receive a PDF with three numbers: samples distributed, locations covered, and field team deployment days. This is not data. It is an activity summary. The brands that generate the most value from their sampling investments treat the campaign as a data collection exercise — not just a distribution exercise.
What We Actually Capture
At every sampling interaction, we collect four categories of structured information:
Consumer demographics: Age range, gender, residential area, household size, and stated income segment. This tells you who actually received your product — not who you intended to reach.
Product response: First reaction data, sensory feedback where relevant, and intended use context. For a food product, this includes taste preference. For a personal care product, scent and texture. For a household product, the perceived convenience and ease of use.
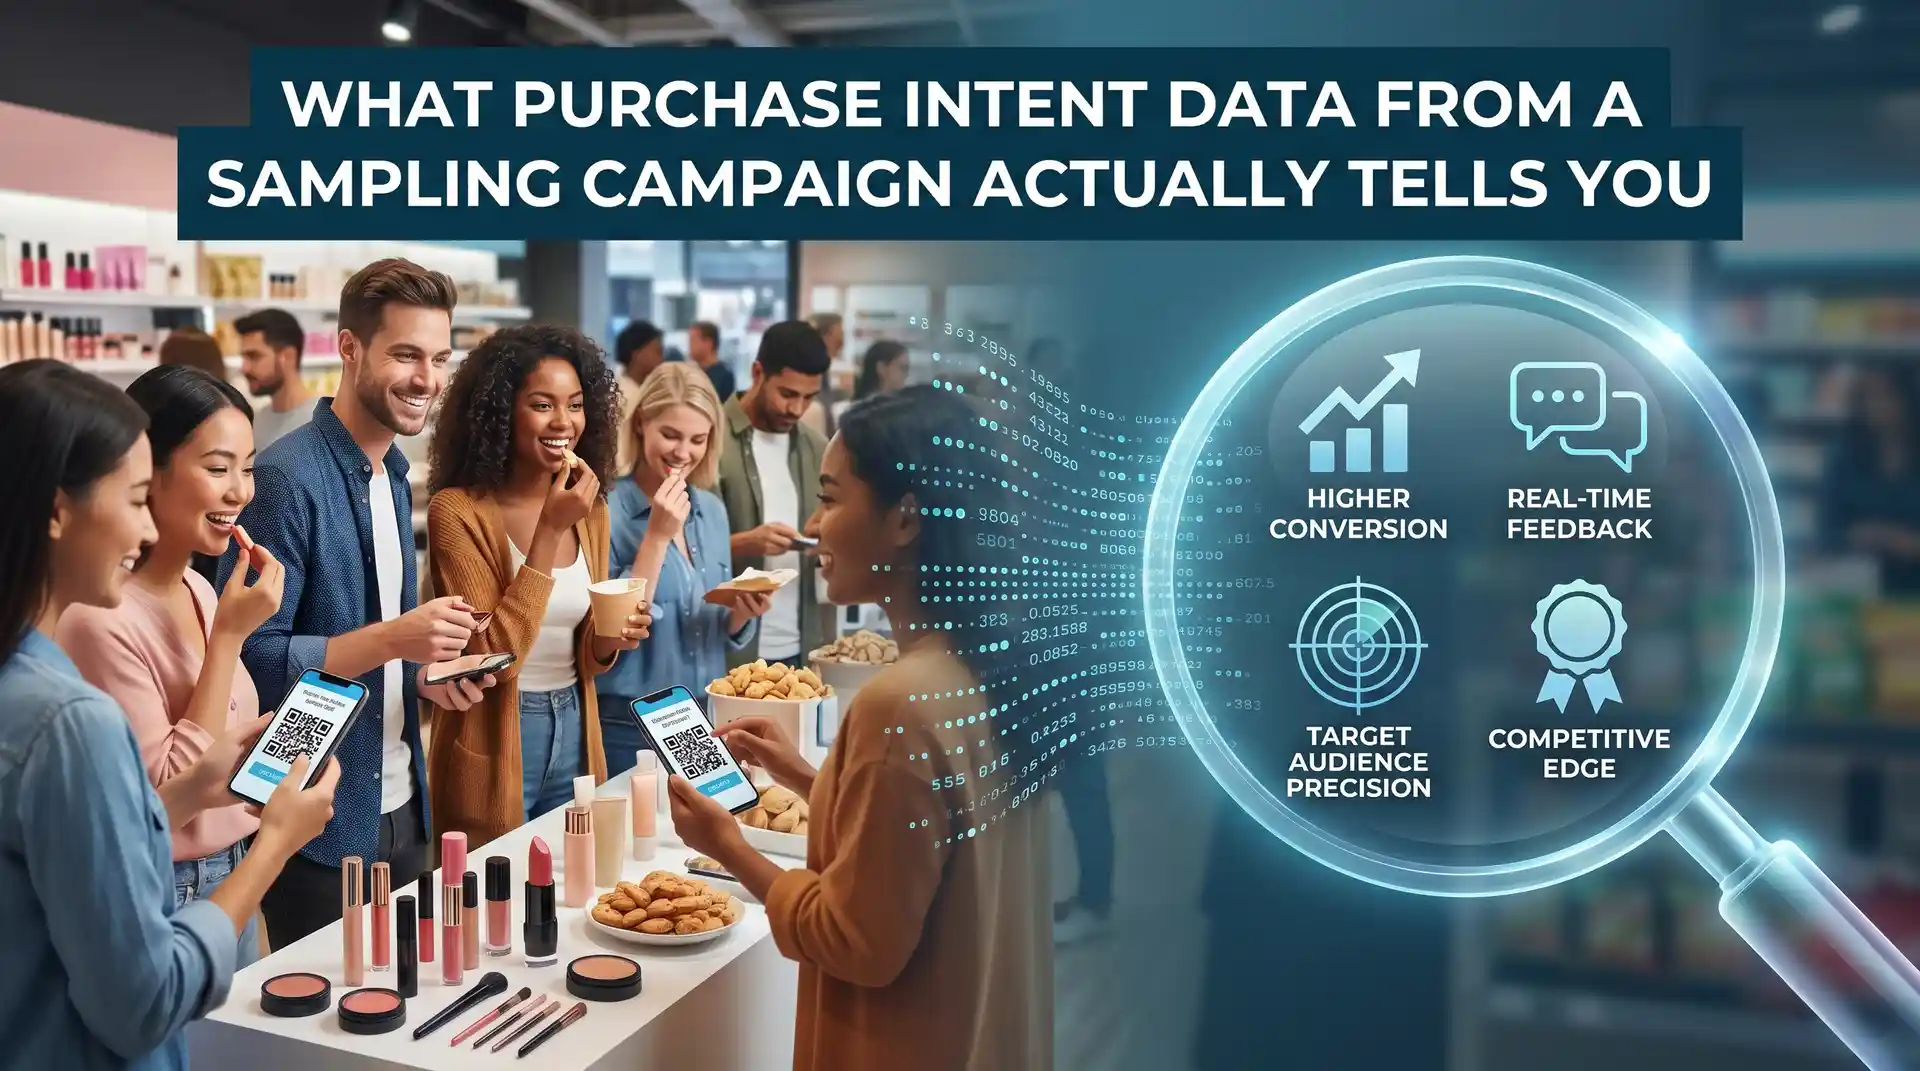
Purchase intent: Stated likelihood of purchase within 30 days, price sensitivity relative to the price communicated, and stated channel preference — modern trade, kirana, quick commerce, or direct online.
Competitive context: What brand the consumer currently uses in this category. This is the most strategically valuable data point we collect, and the one most agencies never ask about.
A 50,000-sample campaign that generates 40,000 qualified data points is worth more than a 200,000-sample campaign that tells you nothing you did not already know.
How to Read the Numbers
Purchase intent at 60 percent or above means your product landed. The consumer-product match is working. Your price point is acceptable at the communicated value, and your trial experience is aligned with what the product delivers in real life. This is a signal to scale the campaign.
Purchase intent between 35 and 60 percent is a signal to investigate. In our experience, this range usually indicates one of three things: the product was distributed to the wrong consumer demographic, the price point communicated does not match the perceived value, or the trial context was not representative of real-world use. Understanding which of these applies is worth more than running a second campaign at the same parameters.
Purchase intent below 35 percent in a well-targeted campaign is unusual — and valuable. Something in the product-market fit equation is not working as intended. That is better information to have from a 50,000-unit sampling campaign than from a failed retail launch at scale.
How Brands Use the Data
The purchase intent data from a well-run sampling campaign feeds directly into four downstream decisions:
Digital retargeting: The demographic profile of high-intent consumers becomes the seed audience for your digital campaigns. Instead of targeting broadly, you are targeting a profile proven to convert after trial.
Retail channel prioritisation: When high-intent consumers consistently report that they would purchase from quick commerce or pharmacy chains rather than supermarkets, that is an actionable distribution insight. It tells you where to invest your trade marketing budget in the months after the sampling campaign.
Product iteration: When a consistent pattern of feedback identifies a specific attribute — a taste note, a packaging usability issue, a scent that does not meet expectations — this information reaches the product team before you commit to a full retail rollout. Sampling is the only channel that generates this kind of structured qualitative feedback at scale.
Pricing strategy validation: Consumer willingness to pay, captured at the point of trial, is a more reliable pricing signal than focus groups. It reflects real intent in real context — not what a consumer says they might do in a research setting.
The Dashboard We Deliver
Every campaign we execute closes with a structured ROI report delivered via client dashboard. It includes sample distribution data broken down by location and field team, consumer feedback by demographic segment, purchase intent rates with variance across cities and channels, and a recommended action plan for the next campaign cycle.
The goal is not a report you file. It is intelligence you can act on within the week after the campaign closes. That is the difference between running a sampling programme and running a market research exercise that also happens to put your product in consumer hands.